If you're making web apps or HTTP APIs with Python, WSGI remains a solid choice for the underlying framework for handling HTTP requests and responses. ASGI is getting a lot of attention these days (see, for example, starlette) but in many cases the concurrency model of WSGI, which can be roughly translated as "let the web server deal with that", is easier to deal with or more appropriate for the service being provided.
Or it may be that you're maintaining an existing WSGI app, and switching to ASGI is not something you can or want to do soon.
In either case, you've got your WSGI app, and you'd like to make it faster. What do you do? Profile.
WSGI apps can be profiled by wrapping the application in middleware which starts and stops the python profiler for each request and does something with the profile information. The one I prefer is a part of Werkzeug, the ProfilerMiddleware.
The most convenient way to use it is to configure profile_dir to
point to an (existing!) directory. For each individual request, a
file will be created in that directory, named after the request
method and URL. It will contain the profile stats for that request.
There are lots of ways to interpret those stats. One is to use the pstats module but that can be cumbersome. Lately I've been using snakeviz. It provides a web-based interface to graphically navigate the profile data and see at a glance where python code is consuming time.
Putting It Together
To provide a bit more insight into how this might be useful, I'm going to explain how I used it to find a section of the OpenStack placement code that might respond well to some optimization. Recently we gained a significant performance improvement in placement by removing oslo.versionedobjects (useful stuff, but not needed in placement) but it feels like there is plenty of room for more. Here's what I did to explore:
Updated my local repo of placement:
git clone git://git.openstack.org/openstack/placement
cd placement
Established a suitable virtual environment and added some additional libraries (werkzeug has the profiler, uwsgi will be the web server):
tox -epy37 --notest
.tox/py37/bin/pip install uwsgi werkzeug
Mangled placement/deploy.py to make it easy to control whether the
profiling happens. This can be important because for some requests
(such as loading all the masses of data done in a step below) you
don't want to profile. Patch also available in in
gerrit.
diff --git a/placement/deploy.py b/placement/deploy.py
index e442ec40..c9b44b8f 100644
--- a/placement/deploy.py
+++ b/placement/deploy.py
@@ -11,6 +11,8 @@
 #    under the License.
 """Deployment handling for Placmenent API."""

+import os
+
 from microversion_parse import middleware as mp_middleware
 import oslo_middleware
 from oslo_middleware import cors
@@ -28,6 +30,11 @@ from placement import resource_class_cache as rc_cache
 from placement import util


+PROFILER_OUTPUT = os.environ.get('OS_WSGI_PROFILER')
+if PROFILER_OUTPUT:
+    from werkzeug.contrib import profiler
+
+
 # TODO(cdent): NAME points to the config project being used, so for
 # now this is "nova" but we probably want "placement" eventually.
 NAME = "nova"
@@ -61,6 +68,13 @@ def deploy(conf):
     request_log = requestlog.RequestLog

     application = handler.PlacementHandler(config=conf)
+
+    # If PROFILER_OUTPUT is set, generate per request profile reports
+    # to the directory named therein.
+    if PROFILER_OUTPUT:
+        application = profiler.ProfilerMiddleware(
+            application, profile_dir=PROFILER_OUTPUT)
+
     # configure microversion middleware in the old school way
     application = microversion_middleware(
         application, microversion.SERVICE_TYPE, microversion.VERSIONS,
What's happening here is that if the OS_WSGI_PROFILER
environment variable is set, then the PlacementHandler application
is wrapped by the ProfilerMiddleware. It will dump profile data to
the directory named in OS_WSGI_PROFILER. This is a messy, but
quick and convenient, way to manage things.
Created a short script to start the application with the right configuration settings (via the environment):
#!/bin/sh

export OS_PLACEMENT_DATABASE__CONNECTION=postgresql+psycopg2://cdent@192.168.1.76/placement?client_encoding=utf8
export OS_PLACEMENT_DATABASE__SYNC_ON_STARTUP=True
export OS_API__AUTH_STRATEGY=noauth2
export OS_DEFAULT__DEBUG=True

.tox/py37/bin/uwsgi -M --venv .tox/py37 --http :8000 --wsgi-file .tox/py37/bin/placement-api --processes 2 --threads 10
If you're following along at home, for DATABASE_CONNECTION you
will need to establish the database (and access controls) yourself.
Loaded a bunch of data into the service. For this I used placeload, a tool I made for this kind of thing. Add 1000 resource providers with inventory, aggregates and traits with:
placeload http://ds1:8000 1000
(ds1 is the hostname of the VM where I have this stuff running,
your name will be different.)
Made sure it's all there by getting a list of resource providers:
curl -H 'openstack-api-version: placement latest' \
     -H 'x-auth-token: admin' \
     http://ds1:8000/resource_providers
Restarted the WSGI app, ready to profile. Ctrl-c to kill the
uwsgi server, then:
export OS_WSGI_PROFILER=/tmp/placeprof
mkdir $OS_WSGI_PROFILER
run_the_script
Made a request, this one to get a list of all those resource providers again:
curl -H 'openstack-api-version: placement latest' \
     -H 'x-auth-token: admin' \
     http://ds1:8000/resource_providers
Ran snakeviz on the output:
snakeviz /tmp/placeprof/GET.resource_providers.000108ms.1552408596.prof
This opens the default web browser in the local GUI, so if you were
running your server remotely, you'll need to copy the *.prof file
to somewhere local, and install snakeviz there. Or go back in time
and use X11.
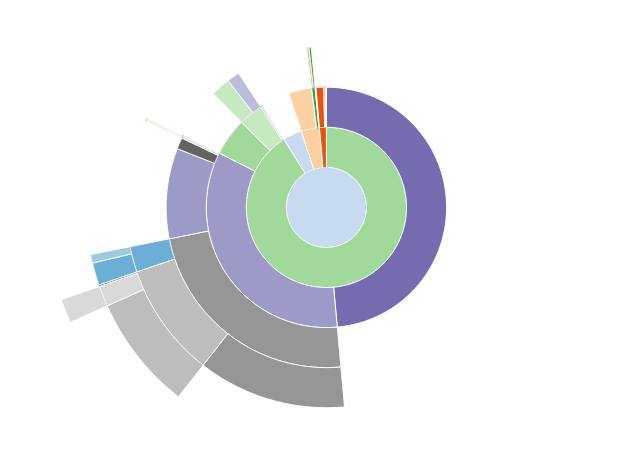
If the output style is set to 'Sunburst' (the other option is 'Icicle') you see a set of concentric circles like those in the image above. The length of an arc indicates how much time a particular call used up (total time across all calls). Mousing over will reveal more information. Clicking will zoom on that call, making it the center of the sunburst.
The initial output shows that the _serialize_links method in the
resource provider handler
(placement/handlers/resource_provider.py) is using a lot of time.
Looking at the table below the sunburst (which starts out the same
as the output produced by the pstats module, ordered by total time
in a call) we can see that though it uses only a relatively small
amount of time per call, it is called many times (once per resource
provider). There may be an opportunity for a micro-optimization
here. The same three conditionals with the same results are
performed every time we go into the call. We could instead pull that
out, do it once, and save the results. It might not be worth the
effort, but the profiling gives us something to look at. If we clear
out that hump, we can then find the next one.
There are plenty of other requests that could and should be
profiled. Notably GET /allocation_candidates and PUT
/allocations/{uuid}. These are the two requests which are most
important to the running a cloud (once it is up and running stably).
Also, it is worth noting that there is a stack of changes already in progress which changes a lot of the code being measured here. Profiling those changes suggests it might be time to explore using generators instead of lists in many places. I didn't, however, want to make this post rely on unmerged code.
Profiling can be a useful tool. Even if it doesn't lead to dramatic changes in the code and spectacular performance improvements, doing the research is very revealing about what your code is getting up to. Like all tools, it is one of several. No silver bullets.
Update!
As is so often the case, profiling can also lead you down a hole. Moving
the conditionals in the _serialize_links described above doesn't gain much of
anything. So if there is an optimization to be had here, it will
involve some more robust changes to how resource provider output is
assembled. But now at least we know.